At Alibaba.com, our mission is to be an ally to small and medium-sized businesses (SMBs) and help them succeed. To better serve these businesses, we’re issuing the Alibaba.com B2B Pulse, a monthly update that serves two primary purposes: First, we will aggregate the biggest macro developments relevant to US SMBs and second, we will share proprietary insights into US B2B demand that we observe on the Alibaba.com global B2B marketplace.
We hope this helps our customers, media, and wider community of people in the B2B world have a richer understanding of the landscape. We also hope to have some fun with this as B2B sales often act as a leading indicator for what’s to come not only in retail trends, but even changes in our everyday lives.
5 things about US B2B SMBs this month
1. Small and medium-sized business confidence continues to drop, though not as badly as in April 2020
From mid-July to mid-August, the share of small businesses expecting a return to normal operations to take six months or longer rose from 32.5% to 39.1% according to The Economic Innovation Group’s analysis of the U.S. Census Bureau’s Small Business Pulse Survey. This is about a five months’ loss of progress. According to Vistage, “All components of the Small Business Index declined from [July], but declining optimism in the economy was the component that had the largest decline.” However, 20% of SMBs expect the economy to worsen, compared to 57% in April 2020. A recent Verizon survey shows 68% of SMBs expect their business to be better off in a year, and 53% report that the overall state of their business has improved since August 2020.
2. More than two-thirds of SMB retailers are tapping into personal financial assets to stay afloat
Goldman Sachs reports that 44% of US SMBS have less than three months cash in reserve. In a recent PYMNTS survey of 2,400 US SMBs with physical storefronts, 67% relied on personal financial assets to cover cash flow gaps. Nearly half of the survey respondents resorted to not paying their rent or their suppliers as strategies to manage cash flow. 49.7% reported not paying their suppliers or monthly bills when cash got tight. And while 20% said they only did this in 2020, 30% either continued or started in 2021.
3. Over 44 freight ships await entry into California ports, the highest number recorded since February
The two largest California ports — in Los Angeles and Long Beach — account for about one-third of all US imports. While these ports have experienced heavy congestion throughout the pandemic, Bloomberg reports that they are now seeing a six-month high of 44 freight ships awaiting entry. To put this in perspective, “The normal number of container ships at anchor is between zero and one,” according to Insider. In June 2021, the average wait for berth space was 5.7 days. Now, it’s increased to 7.6 days. According to TIME, this port congestion combined with rising prices across every part of the supply chain, from manufacturing and labor costs to “shipping companies…raising prices, sometimes forcing companies into bidding wars to nab limited spots on ships” is causing higher prices across all sectors, and is expected to last well into 2022, according to The Wall Street Journal.
4. Average selling price in the retail sector rises 11% year-over-year
The Salesforce Shopping Index indicates the average selling price climbed to 11% YoY in the retail sector. Meaning inflation is hitting the retail sector quite hard. Meanwhile, the Baltic Dry Index (BDI), a compilation of average prices for the transportation of dry goods across trade routes, climbed past 4,000 points. This is the highest it’s been since June 2010. Because of this, we’ve seen more than a 50% increase in the cost to transport goods. This translates to substantial increases in prices for everything from toys to dry goods in the coming months — something to keep in mind as holiday shopping approaches. Alana Semuels, a Senior Economics Correspondent, illustrates this in her piece for TIME. She ordered a stuffed animal and tracked every step of its journey — showing how price increases throughout the supply chain caused a much higher final price for the stuffed animal. See the chart below.
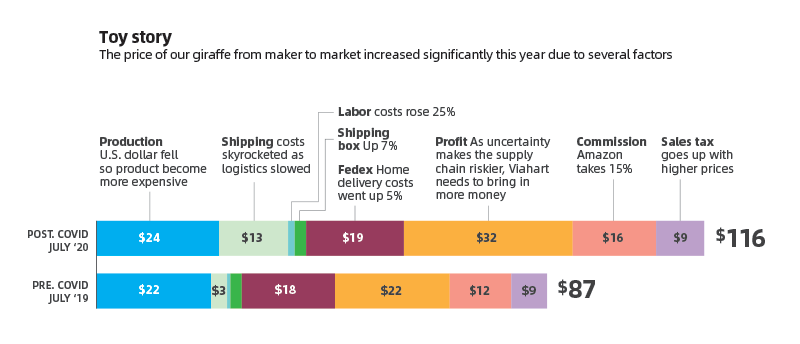
Source: TIME
5. 90% of SMBs plan to increase employee benefits to overcome the labor shortage
Business owners across industries are dealing with the ongoing labor shortage. Aside from COVID-19 effects, “The mass exodus of baby boomers from the workforce, record low participation rates among the working-age population, and the lowest birth rates in the US will all lead to a long-term shortage of workers,” according to The Business Journals. SMBs are looking to new methods to attract and retain workers. According to the latest Principal Financial Well-Being Index, SMBs reported “an increased focus on key employee well-being initiatives and benefits to help make them more competitive.” More than 90% of the 10,000 businesses surveyed plan to increase at least one benefit over the next 12 months.
US B2B trade trends on Alibaba.com
As one of the world’s largest B2B ecommerce marketplaces, activity on Alibaba.com can offer unique insights into what’s happening in B2B trade, what we might see in future B2C trends, and even the broader economy.
Top 5 categories averaging 53% YoY growth in daily demand, August 2021 vs. August 2020
- Commercial Service Equipment
- Toys & Hobbies
- Tools & Hardware
- Minerals & Metallurgy
- Electronic Components, Accessories & Telecommunications
Some categories have remained in the top 5 since last month. This includes Commercial Service Equipment, Toys & Hobbies, and Minerals & Metallurgy.
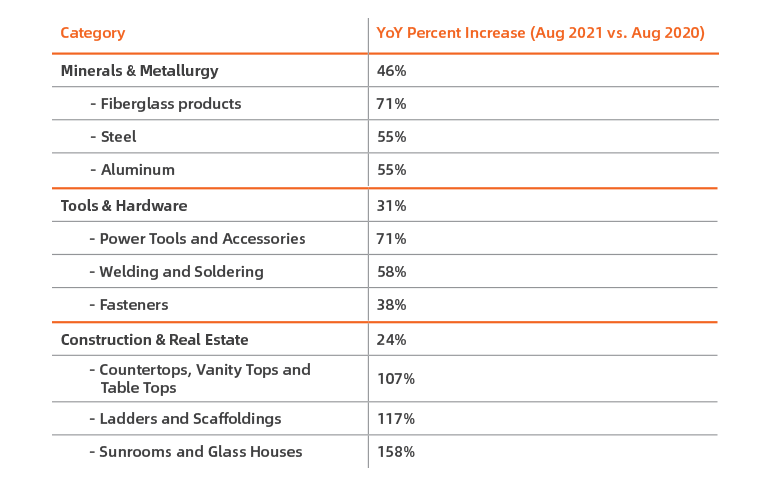
Despite supply chain challenges and disruptions brought on by the pandemic, the US construction industry is estimated to grow by over 15%. The fastest-growing categories on Alibaba.com together reveal that indeed, the construction and renovation boom we’ve been seeing in the early part of this year is not slowing down. In addition to steady YoY and MoM growth in demand for Tools & Hardware (31% YoY) and Minerals & Metallurgy (46% YoY), there was also a 24% YoY increase in daily demand in the Construction & Real Estate category.
Interestingly, demand for Apparel, Fashion Accessories, Shoes & Accessories, and Beauty & Personal Care has declined slightly between Aug 2020 and Aug 2021. Sub-categories that experienced year-over-year decline include:
- Women’s Clothing (while Men’s Clothing demand remained largely stable at 2% YoY growth)
- False Eyelashes & Tools (while demand for Makeup & Tools almost doubled)
- Fragrance & Deodorant (while Beauty Equipment saw an increase of 64%)
- Bath Supplies (while Skincare products demand grew by 22%)
Taking a closer look at MoM movements, here are the biggest “movers” between July 2021 and August 2021:
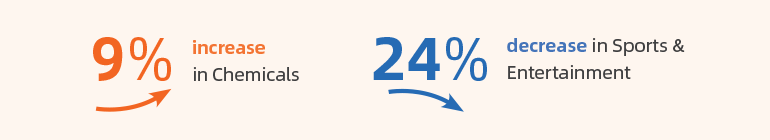
While the daily demand in the Sports & Entertainment category continues to grow YoY, that growth is slowing down between July and August, primarily driven by tapering levels of outdoor activity in the upcoming winter months. Biggest movers within the category include:
- Water sports equipment (-44% MoM)
- RVs and Campers (-40%)
- Boats and Ships (-41%)
What’s next?
As we continue to see severe supply chain disruptions, and as the holiday season approaches, now is the time for retailers to stock up. And Super September, Alibaba.com’s largest sale event, is the best time to do so. Along with up to 40% off all categories, Alibaba.com is introducing new services and solutions retailers can take advantage of — from Alibaba.com Dropshipping Solutions to virtual reality showrooms and livestreams.
Stay tuned for the next issue of the Alibaba.com B2B Pulse to see how Super September sales cause ripple effects across all different categories.
Download full report